 We’ve all heard the expression, “how do you eat an elephant? One bite at a time.” The inventor of this phrase must have been marooned and starving on an elephant-infested island, because seeing an elephant and wondering, “how am I going to eat that thing?” is not exactly a normal reaction. Even an avid steak-eater likely doesn’t see a cow and immediately wonder how to eat it. But however it happened, someone noticed that attempting to eat the world’s largest land animal in one go would be a challenge, and was wise enough to point out that taking a large task one small step at a time is much less daunting. When it comes to fair lending, you may be looking at a mountain of data and wondering how on earth you can sift through it all to come up with anything meaningful. The good news is that there’s an even better way of doing it than taking it one bite at a time, and that way is regression analysis.
If you weren’t a stats major in college, just the idea of a regression analysis might make you break out in cold sweats. But regression analysis is a key way of measuring your institution’s lending habits to make sure that no loan applicant is treated unfairly throughout the lending process because of any of the prohibited bases, such as race, religion, or sex. Having a basic understanding of what regression analysis is and how it comes into play in fair lending can help you get a better handle on your institution’s fair lending risk.
The Equal Credit Opportunity Act outlines the prohibited factors that are applicable at any stage of the lending process, from the application and underwriting through servicing and payoff activities. To accurately understand these risks, you need to first understand your data and what they say about your institution. But sometimes, a basic fair lending data analysis isn’t enough to determine if there are any unfair lending practices or discrimination going on. This is especially true seeing as examiners expand their field of focus beyond just pricing and approvals. That’s where a regression analysis can be helpful.
What Does a Regression Analysis Do?
Ultimately, a regression analysis helps to determine if your institution is lending within a predicted range based on all other factors being equal or at least close. It does this by examining and comparing several different loan variables, such as loan amount, credit score, loan product type, etc.
For example, say you took a look at your loan decisioning data for a given product, such as used auto loans, in two areas of your community with differing minority concentrations, and it looked something like this:
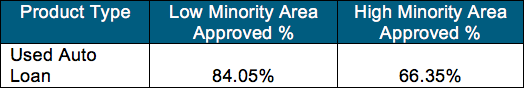
Here we see an 84% approval rate in a low-minority area compared to a 66% approval rate in a high-minority area. Someone might look at this and think your institution has a big fair lending problem. This is where a regression analysis could come in handy. To determine if there are disparities, a regression analysis isolates certain variables to determine how much they impact lending activity.
Variables might include such factors as product type, credit score, loan amount, debt-to-income ratio, loan to value, and term. A regression analysis will control for these variables and enable you to project what approval rates would be expected for minority and non-minority applicants, with all other factors being equal. It could also be used to compare predicted approval rates for other prohibited bases, such as gender or marital status.
But for now, let’s see what happens to the approval rates for our hypothetical institution with minority and non-minority applicants when we control for those other variables:
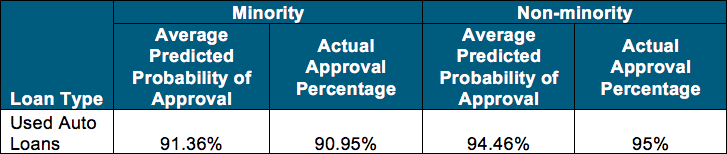
Here we see a four percentage point difference in approval percentages between minority and non-minority applicants. However, when we predict the approval percentage of minority and non-minority applicants with all the other factors being equal or close to equal, we see that the predicted and actual approval rates are fairly close for minority applicants, with less than one percentage point difference for both groups.
How Can Regression Analysis Help?
Approval versus denial rates are just one area that can be examined more closely through a regression analysis. Another area is a comparison of pricing. Here’s an example of how a regression model can project predicted APRs and compare them against actual rates to determine if any disparities occurred. It may look something like this example for conventional home purchase loans:
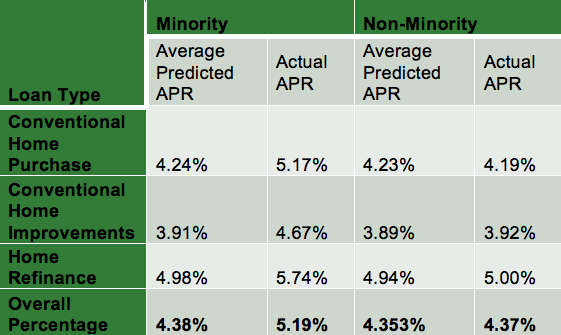
In this example, we might see that the predicted APR rates are similar for minority and non-minority applicants, but the actual rate is nearly a full percentage point higher for non-minority applicants. This may not suggest an actual fair lending problem, but it might suggest an area where the financial institution may want to dig deeper. At this point, the institution may want to conduct a comparative file review of several minority applicants and non-minority applicants where all other factors being equal have an APR discrepancy of one percentage point or more.
Ultimately, we want to find specific cases that “prove” whether there is an issue that goes beyond the regression. As such, the regression helps to eliminate the need for comparative file review. If the regression shows an issue, a comparative file review can help us explain the differences that couldn’t be completed by the regression analysis.
But all in all, if your basic fair lending data analysis highlights any areas of concern, it may be good to go into greater depth with a regression analysis to make sure if there are lending disparities where further review, such as a comparative file analysis, may be warranted.


