Originally published on CUInsight.com
When I was young, a teacher shared an analogy that has always stuck with me. I can’t exactly remember what she called it, but I’ve taken to calling it “2-D Bob Meets 3-D Jill.” My teacher started by sketching a diagram on the board that looked something like this.
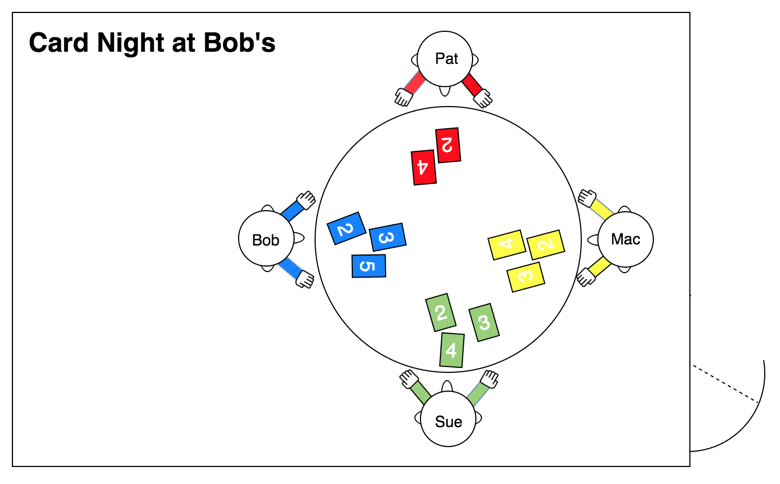
Bob has invited some friends over to play cards. Everything in Bob’s world is 2-D, including Bob, his friends, the card table, the cards, and even Bob’s house. Everything exists on a single, flat plane and there is no third dimension. (You may wonder how the 2-D card players could see the numbers on the cards that are flat on the 2-D plane, but probably best not to think about this analogy too hard.)
Suddenly, they hear a woman’s voice, “Hello.” They look around for the source, but can’t see anyone. “My name is Jill,” says the voice. Not being able to see who is talking is alarming, and Bob’s three friends flee out the door, leaving Bob all alone. He locks the door behind them.
“I’m sorry, I didn’t mean to alarm anyone,” says the voice.
“Where are you, and why can’t I see you?” asks Bob.
“I’m standing right here on the other side of the wall,” explains Jill. “Here, I’ll step inside.”
“Impossible,” says Bob. “I have locked the door.”
“Don’t be silly,” says Jill, and she proceeds to step over the wall, which in her 3-D world is merely a line on the ground.
“Here I am,” says Jill. Bob is shocked, because someone or something has suddenly appeared in his house, despite his locked door, and all he can see is the following:
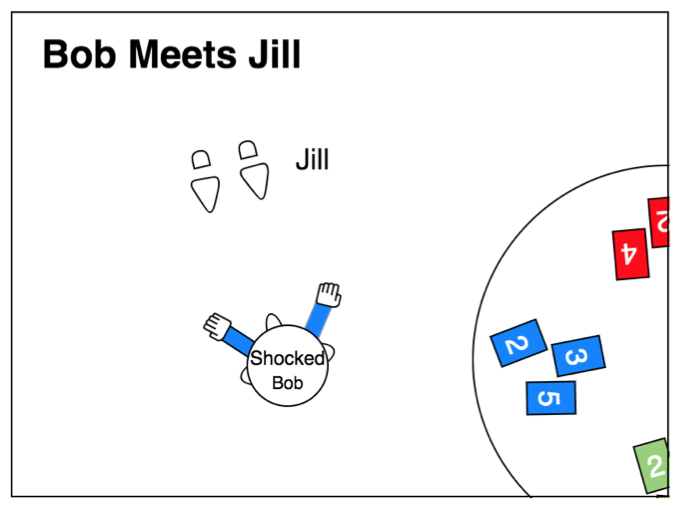
3-D Jill is wearing heels, so from 2-D Bob’s limited perspective, Jill has no head, no nose or ears, and no arms.
“You’re four disconnected shapes?” asks Bob.
“Oh, I understand what is going on from your perspective,” says Jill. “Here, let me pass through the floor. That should help.”
Jill proceeds to pass through the floor of Bob’s world, plane by plane, slice by slice, which befuddles Bob, who sees for a time two circles (Jill’s legs), a big circle and two small circles (Jill’s torso and arms), a single circle (Jill’s neck), and then she finally stops when she gets to halfway through her head.
“Ah,” says Bob. “Now I see you. Nice to meet you, Jill.”
“Nice to meet you, too, Bob. But there is actually much more to me than what you see.”
From my teacher’s story, I learned that, when something seems befuddling or complicated, it can be helpful to seek to add a third dimension into the equation, and I have found this to be the case in my many years of conducting anti-money laundering validations, risk assessments and look-back projects for credit unions and banks.
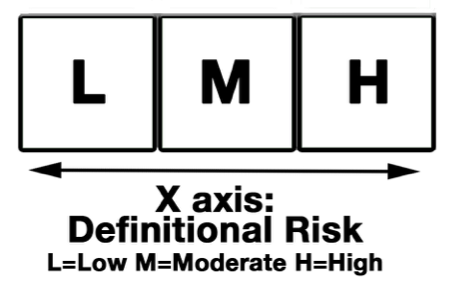
Definitional Risk (the X-Axis)
If AML systems for financial institutions consisted of a single dimension, it would most likely consist of assigning a risk rating to each of its members based on their definition: low on one end, high on the other. It might look something like the following:
The assigning of risk categories to businesses and individuals is typically based on FFIEC guidance provided a number of years ago. In the Bank Secrecy Act Anti-Money Laundering Examination Manual, there are broad definitions of customers who pose specific risks due to the “nature of their business, occupation, or anticipated transaction activity.” The definitions are as follows:
- Foreign financial institutions, including banks and foreign money services providers (e.g., casas de cambio, currency exchange, and money transmitters).
- Nonbank financial institutions (e.g., money services businesses; casinos and card clubs; brokers/ dealers in securities; and dealers in precious metals, stones, or jewels).
- Senior foreign political figures and their immediate family members and close associates (collectively known as politically exposed persons (PEP)).
- Nonresident aliens (NRA)
- Foreign corporations and domestic business entities, particularly offshore corporations (such as domestic shell companies and Private Investment Companies (PIC) and international business corporations (IBC)) located in higher-risk geographic locations
- Deposit brokers, particularly foreign deposit brokers.
- Cash-intensive businesses (e.g., convenience stores, restaurants, retail stores, liquor stores, cigarette distributors, privately owned ATMs, vending machine operators, and parking garages).
- Nongovernmental organizations and charities (foreign and domestic).
- Professional service providers (e.g., attorneys, accountants, doctors, or real estate brokers)
The bullet dots “Cash-Intensive Businesses” and “Professional Service Providers” are the primary problem elements for most financial institutions. Many financial institutions have searched the world over for an all-inclusive list of entities that might fall under these categories. There are partial lists and various organizations and individuals who provide their lists, but typically they’ll be specific to whomever created the list. Regulators themselves have been averse to providing such a list. This makes sense because it would tend to focus monitoring on those entities on the list and remove other entities that may, upon closer inspection or upon evolving circumstances, need monitoring.
A more progressive approach from a regulatory standpoint is to leave the defining up to institutions.
As such, if your institution collects NAICS codes, it makes sense to review your business entities’ codes and seek to classify the various codes as high-risk, moderate-risk and low-risk. Some institutions will use more classifications than that, but the main idea is to establish a range of what constitutes a definitionally higher-risk entity.
Transactional Risk (the Y-Axis)
Although transactional activity within any financial institution has seemingly unlimited complexities, we can usually classify most transactions to a finite set of types that we call “The Big 7.” They are:
- Currency
- Checks
- Monetary Instruments
- Electronic
- Loan
- Fund Transfers/Wire
- Exchanges
Even within the seven categories there are cross-elements (currency and exchanges, funds transfer/wire and electronic, etc.). There is also a finite number of transaction processes that are largely denoted by the instrument types. Indeed, most money is coming or going or a combination of the two – debits and credits. It may not always be so two-dimensional, but there typically is order to the flow of funds.
If you assign customers into a risk category based on their transactional data and put that on the Y-axis, you may have something that looks like this:
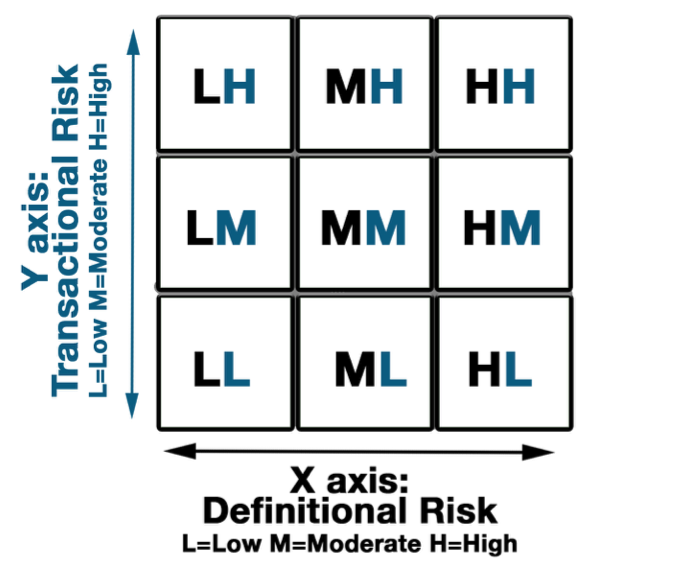
Typically, the closer a member is to the upper right corner of this grid, the greater the scrutiny or the greater the frequency of the review. As beneficial as it is to add the Y-axis into the equation to enhance the efficiency of an AML system, even that two-dimensional world can lead to too many unproductive alerts (just ask Bob), swamping the limited resources available to clear them.
As such, it can be helpful to introduce the third axis, the Z-axis.
Outlier Risk Factors (the Z-Axis)
The Z-axis is what we refer to as “outlier risk factors.” The specific outliers will vary based on what data the financial institution has available. It might look something like this:
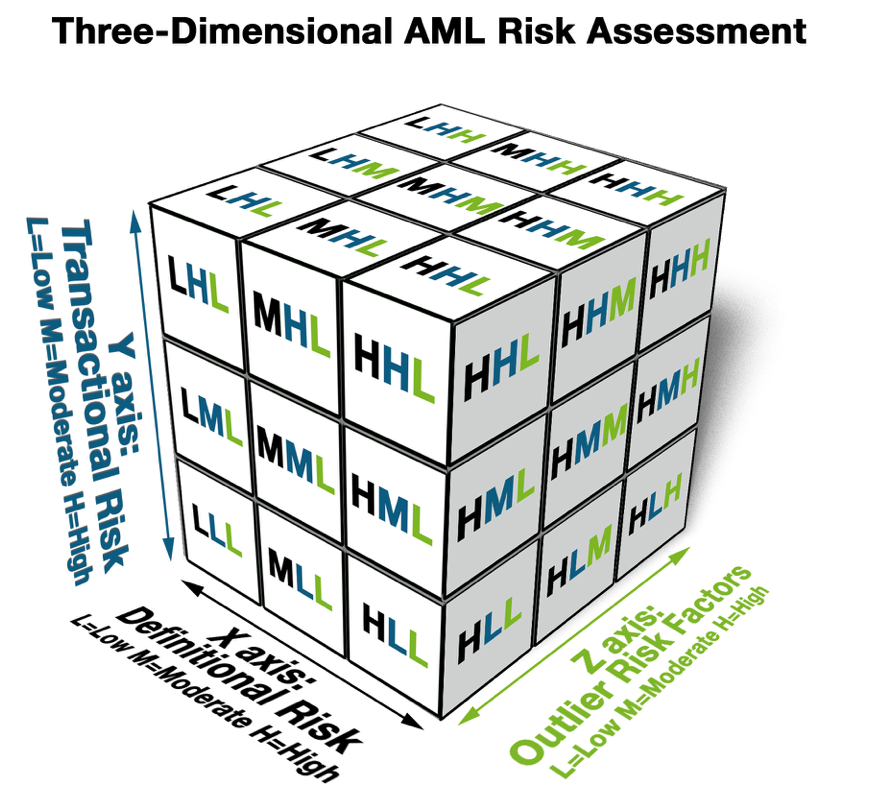
At a minimum, the Z-axis can be extracted from the X- and Y-axis analyses, but with data at a more granular level. For example, financial institutions that collect NAICS coding on their business entities can conduct meaningful comparative analyses of all entities with given codes where sufficient volume is available. Let’s say you have 100 customers who own restaurants. You could compare their transaction levels with each other in the search for outliers; a restaurant in a resort town that makes heavy deposits throughout the year, when other restaurants slow down significantly in the off-season, may be in the “HHH” section of the cube and warrant closer scrutiny.
Another example for business entities would be a comparison of cash-to-ACH-wire ratio analysis. If, for example, the majority of customers within a certain NAICS code deposit 50% cash and 50% ACH, but you have a few customers who are all cash or all ACH, that could push them toward the HHH corner of the cube, making them also candidates for closer scrutiny.
A less-obvious example would be a customer who is low risk by definition and low risk by transactional activity (in other words, in the lower left corner of the two-dimensional grid). Such a customer might be a printing shop (considered low-risk) whose transactional activities do not alert. However, if such entity was owned by an individual with a subpoena, the customer would move towards higher risk on the Z-axis. From there, while the transactional activity might not have alerts within the AML system, the same data might be used to identify other factors meriting consideration, such as potential intra-customer and related customer account transfers. Such transfers could indicate money laundering via integration. BSA Departments armed with this third dimensional analysis from the Z-axis benefit from expanded perspectives.
Why This Matters
Over the past few years, as we have conducted scores of AML system validations, we have detected not a small amount of frustration among BSA personnel over the inefficiencies within their AML systems. They tell us far too many alerts are generated per Suspicious Activity Report filed. Too often we find that these AML systems are, at best, only considering X- and Y-axis elements. What is lacking is the identification of available candidates for meaningful Z-axis analyses. Frequently, the necessary data points for the Z-axis are already there, they just need to be added into the mix, where they can reduce frustration levels significantly.
When facing the complex challenges of living in a 3-D world, limiting yourself to Bob’s 2-D vision can mean your financial institution is devoting far more resources to conducting due diligence and clearing alerts than necessary. Adding Jill’s 3-D perspective allows you to determine with greater precision where the highest risks are, including those that might evade 2-D detection, so that you can concentrate your available resources on where they will be most effective.
 Ken Agle, President of AdvisX, brings more than 25 years of experience covering almost all facets of financial institution risk management operations. He has conducted more than 350 compliance reviews and has assisted more than 200 financial institutions throughout the United States. He has developed and implemented systems and training programs on all phases of banking risk management, including, but not limited to BSA/AML, fair lending, loan review, HMDA, CRA, BSA, operational compliance, TILA, and RESPA. He has written numerous regulatory responses and appeals and has been instrumental in assisting institutions with challenging circumstances while facing regulatory enforcement orders. He has partnered with McGladrey & Pullen, RSMI, Promontory, Sheshunoff and other multi-region firms to provide support services to financial institutions. Mr. Agle specializes in strategic regulatory response and in developing and implementing both proactive and reactive tools and systems to preempt and resolve issues affecting today’s financial institution. For information on AdvisX’s look-back services, contact Ken at ken.agle@advisx.com.


