 It’s common knowledge that the part of an iceberg that can be seen above the surface is just a small portion of the whole iceberg. In fact, about 90 percent of the iceberg is hidden below the water’s surface. If you are trusting your fair lending risk to just the data visible on the surface, there is a lot that you’ll miss. In our last post, we described how a regression analysis can be used to see more of your data that is hidden below the surface. If your regression analysis suggests any areas of concern, it may be time to do a deeper dive and get a view of the whole iceberg to see if those concerns do indeed have a legitimate explanation. The best way to do that is with a comparative file review.
The point of conducting a fair lending regression analysis is to determine whether or not there is an issue that goes beyond the regression. Remember, while a regression analysis isolates certain variables (such as product type or loan amount), it is still, for the most part, a view of the surface. A comparative file review, on the other hand, dives in to focus on specific loan pairs.
These specific loan pairings have similar loan factors, such as credit score, loan amount, loan type, debt ratio, loan-to-value, etc. These pairings create an in-depth portrait of the fair lending landscape of the institution. Pairings that may be especially of interest in the comparative file review are those between minorities and non-minorities where loan pricing or decisioning may not appear to be supported by the raw data.
Consider this example of a comparison between a minority applicant and a non-minority applicant and the decisioning:
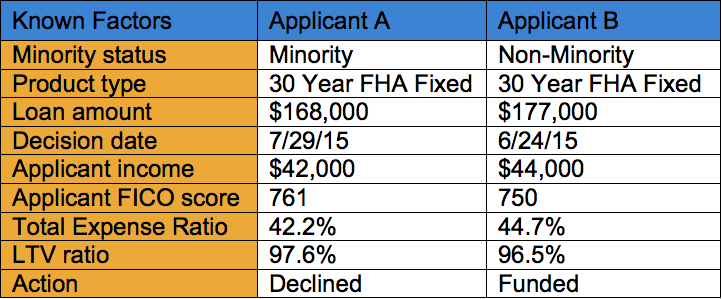
Applicant A is a minority applicant, and Applicant B is a non-minority applicant. Both applied for the same loan product of similar amounts, around the same timeframe. Both had similar income, credit scores, expense ratios and loan-to-value ratios, so the data would expect that both borrowers would be treated the same. However, the minority applicant was declined, and the non-minority applicant was approved. You can see why a deeper dive would be important with this matched pair, and the regression analysis can be used to help identify such pairs.
Once such pairs are identified, an independent party reviews the files to see if there is documentation that provides justification in the decision or pricing of the loans.
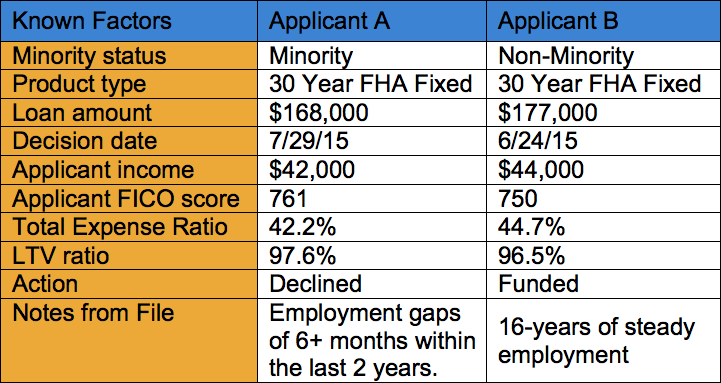
In this case, for example, the reviewer dived into the two loan files, and found that for the minority borrower, there was documentation that said, “The applicant previously had employment at a large department store in a sales position from August 2012 to January 2015. Since then, the applicant has worked full time with a cleaning service, yet was unable to verify this employment. Due to this, the applicant has employment gaps greater than six months in the last two years.”
This is then compared to the reasoning behind the approval of the non-minority borrower, which says, “The applicant has been employed at home shopping network for 16 years.”
With this new information from comparative file review, the reasons for the different outcome have support, and that support could be added to the Fair Lending report.
If on the other hand, both the minority and the non-minority applicants had similar gaps in their respective employment histories, this by itself may not be indicative of a fair lending problem, but then the institution may want to expand its matched pairs analysis to identify whether the treatment in this first matched pair was an aberration or whether there is a pattern of behavior that could be problematic.
Decisioning is just one factor that could be looked at. Another is pricing. Another is controlling not just for minority/non-minority pairs, but for other prohibited bases, such as gender or marital status. An institution that is proactive in conducting a regression analysis and a matched file analysis and who documents its findings has a much better view of the entire iceberg when it comes time for a fair lending examination.


