 Early warning systems have long been around. The Mayans built a temple as a tribute to the God of the Wind. The temple contains an intricate series of holes that cause an extremely loud whistling sound when early hurricane force winds blow in from the Caribbean Sea. That system works even today, and it is as reliable as the most modern computer predictive analytical models used by the most sophisticated meteorological agencies in the world.
The value of early warning has long been pursued because it allows the observer to make course changes even when the disaster cannot be fully avoided. This can be particularly true for those involved in fair lending risk management and especially those who deal with data compiled into the Home Mortgage Disclosure Act or HMDA.
Fair Lending Risk is On The Rise
Fair lending risk is the possibility that an organization’s lending operations treat applicants and borrowers differently on a prohibited basis, treat applicants in an unfair or deceptive manner, or apply predatory lending practices to applicants. Prohibited bases under the Equal Credit Opportunity Act are race, color, religion, national origin, sex, marital status, age, receipt of public assistance income, or the exercise of any right under the Consumer Credit Protection Act. Prohibited bases under the Federal Housing Act also include handicap and familial status. All lending processes including application, underwriting, servicing, collection, delinquency, foreclosure activities, and payoff have inherent fair lending risks.
Disparate treatment involves the consideration of prohibitive factors in making a credit decision. The Equal Credit Opportunity Act prohibits discrimination in any aspect of a credit transaction based on race or color, religion, national origin, sex, marital status, age, the applicant’s receipt of income derived from any public assistance program, or the applicant’s exercise of any rights under the Consumer Credit Protection Act. A credit decision based on any of these factors, referred to as “prohibitive factors,” is illegal.
These factors are often the risk of the storm. If you’ve spent time in the Caribbean, you know what power there is from a hurricane. Similarly, HMDA reporters know that there is a lot of power in the data being reported. This has been particularly true now that enhanced HMDA data has been compiled over the past few years.
But how organizations utilize that data is often quite different. Some compile and submit their HMDA-Loan Application Registers and call it a day. This seems very short-sighted. Others might utilize systems to conduct some level of institution and maybe even peer analysis. This is obviously an enhancement. But going deep into the data and analyzing the patterns associated with identified risk factors that includes regression and comparative file review seems like you’ve built a strong early warning system.
The most likely fair lending storm that faces an institution is a fair lending examination. These can be preceded by limited perceived warnings, but there are early signs for those willing to look. These signs may be found in received or filed complaints but perhaps the best signs are in the actual data itself and the level and trend information related to the institution directly as well as peers.
For example, in the CFPB’s 2021 filed complaint against Trustmark National Bank, it focused on Trustmark’s performance relative to “Similarly Situated” peers, which were organizations that had between 50 and 200% of Trustmark’s applications in specific areas. Using these peers, Trustmark fared poorly in terms of marketing, offering or originating home loans to consumers in majority-Black and Hispanic neighborhoods. The data was based on information between 2014 and 2018.
Clearly, in Trustmark’s case, that signs from that data were there. They were likely there in 2014, 2015, 2016, 2017, 2018 and could even still be there in the 2021 data. Knowing your data and determining how you perform relative to your market and risk factors has never been more important. This is especially true given that Regulatory and Governmental bodies, including the Consumer Financial Protection Bureau (CFPB), Department of Justice (DOJ) and Department of Housing and Urban Development (HUD) have made redlining a top fair lending priority due to concerns about access to credit for minority consumers, with the DOJ citing it as a “persistent problem despite years of enforcement action, and the significant impact on minority communities.”
Key Steps
Establishing the Scoping Process
There are various approaches to fair lending analysis. The Interagency Fair Lending Examination Procedures remain the standard but often are based on older uses of technology. Using advanced statistical analysis and regression techniques can expedite the process and cut down time and costs. That said, using the Examination Procedures to outline a preliminary approach for the statistical analysis makes a lot of sense. For Residential Lending associated with HMDA you should clearly follow the key preliminary steps provided that include:
- Developing an Overview
- Identify Compliance Program Discrimination Risk Factors
- Review Residential Loan Products
- Identify Residential Lending Discrimination Risk Factors
- Organize and Focus Residential Risk Analysis
- Complete the Scoping Process
Once this preliminary element is completed, the basis for conducting statistical analysis and review of risk factors will be well established. AdivsX offers a Fair Lending Questionnaire that serves as a bridge for facilitating the above effort and leading into the next phase.
Conducting the Statistical Analysis
The next phase is also designed to achieve the final phase of the process but serves as its own warning system. Statistical Analysis with Regression. This part of the process requires that data is verified for accuracy. After all, March 1st of each year is designed for all reporters to ensure that they have a valid and accurate Loan Application Register for submission. Without that, analytics are compromised at best and potentially invalid. But once the data is validated, a series of steps aimed at conducting transactional analysis can ensue.
The process for such analytics is often based on an utilized approach. Understanding those approaches is useful. This is probably why organizations that use fair lending systems can miss certain elements necessary for achieving sound fair lending analytics. Advanced statistical analysis can focus on a variety of risk factors identified in the preliminary scoping stages including percentage of applications received from protected groups vs. non-protected groups. When paired with peer analysis of statistical similar entities, an organization can review whether performance levels are sound. An example of this might be as follows:
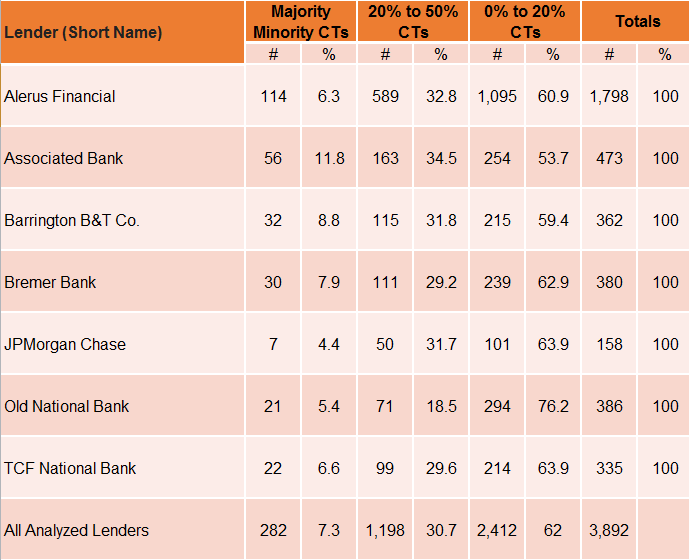
The table focuses on a select product segment that would be established under the preliminary analysis phase. In this case, it focuses on Conventional Refinance (non-Cash Out), 1st lien, Owner Occupied applications and reflects organizations that are similarly situated (e.g., all are commercial national banks) within the selected market area. Using this type of information, organizations can compare baseline performance relative to outcome according to their identified risk factors. This acts as a primer towards more advanced statistical analysis such as Regression.
Regression uses key factors to predict outcomes such as the probability percentage rate of approved or declined relative to protected groups vs. non-protected groups as identified during the preliminary analysis phases. This step can be institutional directed or expanded to include similarly situated. For example, outcome relative to the institution itself might focus on predicted factors such as the following for decisioning:
| Product Type | Minority | Non-Minority | ||
|---|---|---|---|---|
| 2020 Average Predicted Probability of a Declined Loan | 2020 Actual Declined Percentage | 2020 Average Predicted Probability of a Declined Loan | 2020 Actual Declined Percentage | |
| 1 | 18.47% | 19.75% | 16.04% | 14.91% |
| 2 | 26.67% | 44.44% | 22.08% | 22.14% |
| 31 | 31.48% | 42.97% | 27.65% | 24.16% |
| 32 | 45.70% | 78.05% | 49.36% | 46.06% |
| Overall Percentage | 30.28% | 42.25% | 27.15% | 24.34% |
Depending on risk factors identified, the Regression might also focus on pricing such as the following:
| Product Type | Minority | Non-Minority | ||
|---|---|---|---|---|
| 2020 Average Predicted Probability of a Declined Loan | 2020 Actual Declined Percentage | 2020 Average Predicted Probability of a Declined Loan | 2020 Actual Declined Percentage | |
| 1 | 3.79% | 3.70% | 3.65% | 3.64% |
| 2 | 4.44% | 4.19% | 4.33% | 4.24% |
| 31 | 3.70% | 3.56% | 3.61% | 3.64% |
| 32 | 3.94% | 3.64% | 3.96% | 3.96% |
| Overall Percentage | 3.81% | 3.66% | 3.70% | 3.71% |
Whatever elements (and there are many) are pursued, the goal of statistical analysis and regression aims to identify potential risk factors. If identified, and even if not, the use of targeted comparative file review can be critical.
Targeted Comparative File Review
Regulatory comparative file review uses some elements of targeting such as selecting denied minority applicants or denied applicants that were located in minority areas for comparison against funded non-Minorities or funded applicants that were located in non-Minority areas. However, using statistical techniques the opportunity to identify challenging pairs makes sense. Under this approach, the statistical analysis aims to use factors that identify cases where, for example, the pricing for a Minority funded loan should be lower than charged and conversely the pricing for a non-Minority funded loan should be higher than charged, all factors being equal. By focusing on these “challenging” pairs, organizations are best positioned to ensure that their programs are logically established and fair.
Such an approach would have likely benefited Trustmark because the data would have shown the discrepancies in decisioning and/or pricing, but then the actual comparative file review might have provided insights not afforded by the available HMDA data. From 2014 to 2018, that data was highly limited and would absolutely merit comparative file review if discrepancies were identified. The same would be true of today’s data. While credit scores, loan to value and other factors captured in HMDA-LARs have significant merit, they don’t tell the full story on decisioning or pricing. Using targeted comparative file review significantly enhances the ability to establish rationale for any identified gaps relative to decisioning and/or pricing. That step can be powerful as a counter-argument when statistical analysis establishes potential gaps in performance.
Conclusion
The Mayans clearly benefited from their knowledge of wind and their risk of hurricanes. Today’s financial institution faces similar risks in the world of fair lending and has direct access to enhanced knowledge. AdvisX offers sample reports on fair lending and questionnaires used to gather key information for those reports. If interested, please let us know.
